Elwave ad-on for Metastock


ELWAVE plug-in for Metastock

Released: December 23, 2004
Platforms: Windows 98/Me/NT/2000/XP
Required: Metastock version 7.2 or higherELWAVE Add-on for MetaStock is another step forward in the development of one of the world’s best Elliott Wave program which has been made available to fit in the Metastock environment.Simply the best

  • Easy does it
    Already the version 7.5, improved analysis engine has been used. The Metastock add-on targets simplicity, high quality wave count and ease of use. In a straightforward way, no hassle, you can select a chart and have it analyzed for the most preferred Elliott Wave count. It can be downloaded from the internet with a few clicks and no additional protection devices nor manuals need to be shipped. Ofcourse you need to have Metastock installed first.
  • featureslabeling of waves
    The engine analyzes the waves using the Classic rules of the Elliott Wave as defined by Prechter in his book “Elliott Wave theory”. The best, preferred count will be shown on the price data of a Metastock chart, after ELWAVE has researched 1000’s of combinations. See the example below:
    Click to enlarge
    Example: NASDAQ-Chart, analyzed on October 27th 2004 (Close 1.480).
  • featuresExpert Advisor
    In addition to the first step, labeling the waves in the chart, you can ask the Expert Advisor for a crystal clear interpretation of the analysis. This will be explained in plain natural language, now avaialble in English, German and Dutch. First a conclusion will be presented with below a more detailed explanation. See the example below:
    Click to enlarge
    Example: NASDAQ-Chart with Expert Commentary, analyzed on October 27th 2004 (Close 1.480), showing 3 consecutive uptrends, which gives a clear BUY advice with price-targets of 1522 (short-term) to 1538 (medium term).
  • featuresSummary Inspector
    Additional to the Expert Advisor the Summary Inspector is shown in the same window as the Expert. It clearly shows the consecutive wave degrees or patterns in patterns and most importantly, if every wave degree supports the same price direction. One of the nice things it includes is its clear targets for every wave degree, which are based on Fibonacci. This is the most certain, high probability target, which will be reached most of the time. Please see chart above at the bottom of the left window.

But what’s the difference?

Here’s a comparison table of the features of ELWAVE stand-alone vs. ELWAVE Add-on for MetaStock

Feature ELWAVE stand-alone ELWAVE for MetaStock
Support for daily charts YES YES
Support for intraday charts /
realtime through DDE
YES (req. Intraday module) NO
Support for realtime charts
(Fully integrated link to eSignal, Quote.com, RealTick, Tenfore, Tai-Pan and more)
YES (req. UDS ServerFeed module) NO
Summary (multi-timeframe targets, trends) YES (req. Trading Signals module) YES
Target Zones YES (req. Trading Signals module) NO
Scanning (Explorer) YES (req. Scanning module ) NO

Wiebe Vos

Hij is directeur van het software bedrijf Foxware. Hij is gespecialiseerd in software voor optiebeleggers en handelaren.
Hij is 1989 actief op het gebied van financiële analysesoftware. Zijn medewerkers zijn zelf ervaren beleggers en beschikken bovendien over de nodige expertise op het gebied van systeemontwerp en computers. Deze combinatie staat garant voor beleggingssoftware die qua functionaliteit en gebruiksvriendelijkheid als meest vooraanstaand op dit gebied kan worden beschouwd.

Onze specialiteit betreft optieanalyse ten dienst van beleggers in opties en futures.

Aloys Mattijssen

Aloys Mattijssen
die bekend is van diverse publicaties, o.a. van zijn lezersrubriek in het maandblad Technische- en Kwantitatieve analyse, van diverse seminars en zijn bekende cursus (day)trading is de stuwende kracht achter Money2work. Hij heeft meer dan 25 jaren ervaring in de handel van derivaten en aandelen en stond in zijn actieve periode als beurslid geregistreerd bij DSI als “senior trader”. Door vragen uit de markt van niet professionele beleggers en traders is het idee geboren om de opgedane kennis en ervaring ter beschikking te stellen aan derden. Er blijkt een grote behoefte te bestaan aan ondersteuning bij het traden in financiële producten omdat deze handel zeer professioneel, competitief en vele malen gecompliceerder is dan veelal wordt gedacht. Voor de meeste niet professionele traders is het vaak onmogelijk om de achterstand in ervaring in te lopen met als gevolg dat regelmatige verliezen elkaar opvolgen.De benadering door professionele traders van de markt verschilt duidelijk met die van de meeste niet professionele traders.

Conners RSI

The Connors RSI represents a new way to calculate Relative Strength that combines Class (Wilder’s) RSI with two additional indicators.  It is this combination that transformed a good indicator into a truly great one! See the Video

See de PDF

Price € 515,-


Money Zone

The Money Zone is based on the universally accepted concept known as Market Profile. It is being used by Real Time and End-of-Day traders alike to trade the most profitable levels in the market.


See the PDF file

Price € 515,-


XLS-19 V2

Experience the magnitude of Momentum!  XLS-19 has consistently risen to the top of our Strategy List in OmniView as #1.
Now we have improved it so its nearly TWICE as Profitable!

“Our BEST PERFORMING STRATEGY in 2017…”
We released version 1 of XLS-19 in late 2016.

This Strategy has consistently risen to the top of our Strategy List in OmniView as the #1 Performer since release.
Now we have improved it so it’s nearly TWICE as profitable!

PLUS, you can auto-trade it using OmniTrader’s AutoTrade feature.

…as featured in OmniView

BREAKING NEWS
XLS-19 Just Got a Turbo-boost!

 Announcing XLS-19 Version 2

TWICE as Profitable!

The INCREDIBLE NEW Version 2:

· Averaging 38% per Year over 10 years!
· 73% Hit Rate & .91% Profit per Trade
· More Optimal Entries and Less Overnight Exposure
Thanks to research performed by our strategy development team, this new version is one of the most powerful Strategies we have ever released
XLS-19 V2 is the first one to show over 30% Annual Returns since 2007.
XLS-19 works great in difficult markets.

We’ve highlighted both 2008 and 2015 in the equity curve above. These were difficult years for the U.S. markets but BANNER YEARS for
XLS-19, Version 2.


Recent Trades from XLS-19 V2

XLS-19 finds the optimal turning points…

Finds Killer Trades in Up-Trends

…again and again!

AND Superb Trades in Down-Trends

Included in the package:

Jeff Drake’s

Winning with XLS-19 V2 Seminar

Learn How to…
· Use OmniTrader’s AutoTrade feature to automate this awesome Strategy
· Almost DOUBLE your profits on XLS-19
· Improve any RTM Strategy using techniques applied in XLS-19 V2
And more!

Jeff Drake
Director or Trading Technology
Nirvana Systems Inc.

Price €1.545,-

CPRM6

CPRM6 – THE MOST POWERFUL CHART PATTERN
TECHNOLOGY IN THE WORLD IS NOW BETTER THAN EVER!

New Features in CPRM6

  • Multiple Timeframe Chart Patterns & Pattern Columns
  • Two Pre-Configured MTC Pattern Profiles for End-of-Day and Real Time Trading
  • MTC Pattern Trading Seminar

Get an unprecedented edge with CPRM6!

The Chart Pattern Recognition Module (CPRM) automatically finds the stocks with the strongest patterns in the market. Now in CPRM6, we can also find the best patterns in ANY timeframe! This breakthrough in pattern identification technology makes the best Chart Pattern Module more powerful than ever before!

Get MTC Patterns in Higher AND Lower Timeframes

CPRM6 provides the flexibility of getting pattern confirmation in either higher timeframes or lower timeframes – or BOTH! Whether you enable a higher timeframe or a lower timeframe, CPRM6 will analyze all of the enabled timeframes in your Profile and show you any recent patterns.

The Most Highly Confirmed Candidates at Your Fingertips!

CPRM6 provides an all new level of Pattern confirmation. The module includes two pre-configured profiles to help you find the most highly confirmed candidates in the market.

CPRM6 End-of-Day Profile

The CPRM6 EOD Profile looks at the Daily chart and the Weekly chart in order determine which trades have the highest profit potential. Finding patterns in the same direction gives us an incredibly highly confirmed trade.

CPRM6 Real Time Profile

The CPRM6 RT Profile is designed to be run on the 5-minute timeframe to identify patterns for all of the symbols in your Focus List in that timeframe. The profile also looks for any recent patterns in the 60-minute timeframe. This makes it easy to instantly see not only the most highly confirmed Real Time trades, it will also keep you from trading into a strong higher timeframe pattern that could hinder your trade.

Maximize Your Trading with New Seminar

Boosting Profits with MTC Chart Patterns

While the new features in CPRM6 are intuitive and easy to engage, we want to make sure that you have all of the information you need to profit immediately. Boosting Profits with MTC Chart Patterns shows you how to use all the new features in CPRM to help you make consistent gains, and it is included FREE with your purchase of CPRM6.

Sqeeze Trader

SqueezeTrader represents a major advancement in profitable trading. By identifying not only the perfect setup, but also detecting the point at which the market has decided which direction it will trade.

The Power of the Squeeze

The profit magic of SqueezeTrader is based on finding one of the most profitable setups in any market. When bulls and bears lock up on a security, price goes into a “squeeze”. Energy becomes pent up in the battle of conflicting sentiment.

Eventually, one side will win. This leads to an explosive move and BIG profits! Now, Nirvana customers can take advantage of one of the best trading setups ever with SqueezeTrader.

Includes Professional Squeeze Trading Methods

The Squeeze Trade has been used by many professional traders to capture big gains in various markets. We have included the techniques professional traders like John Carter (shown) and John Bollinger use to find the best Squeeze Trades.  But we didn’t stop there. We looked at these approaches and developed them into multiple Trading Strategies so that you can know exactly when to get in and out of a Squeeze Trade


See video below.


Analysis

OmniTrader includes multiple Trading Strategies that provide trading opportunities in any timeframe. Each strategy is preconfigured to find a specific type of trade in a specific market. For example, the RT Reversal strategy is designed to find stocks that are making a sharp trend reversal in intraday trading. Whether you trade stocks or futures, or whether you trade intraday or after market hours, OmniTrader has trading strategies that will give you great trading candidates right out of the box.

If you want to explore trading ideas of your own, OmniTrader makes it easier than ever. With our Strategy Builder flowchart, you quickly define the conditions you are looking for to enter a trade as well as the criteria that is required for you to exit a trade.

StrategyBuilder

OmniTrader provides you with over one hundred trading systems that you can use to generate a trading signal. Our vast indicator library allows you to create filters to better define the type of signal that you are looking for.

Want to know when to get out of a trade? OmniTrader comes with preconfigured Trade Plans that are designed to minimize trading losses and maximize your gains. All Trade Plans are completely configurable so that you can adjust them to match your trading style and risk tolerance.

Stock Scanning

OmniScanYour OmniTrader subscription includes OmniScan, the most powerful stock scanning service available. OmniScans comes with dozens of preloaded stock scans that will provide you with a list of stocks that all meet a certain criteria. Want to know what the most bullish stocks are? Turn on the Big Bulls scan. Want to only see the stocks that are trending nicely? Turn on the Smooth Movers scan. Regardless of the type of stock list you want, OmniTrader has a scan to suit your needs.

OmniScan not only provides you with excellent canned scans, but it also allows you to create scans of your own. Start with all US stocks or a list of stocks in an index, and then apply the criteria that you want to use to filter the list. With just a few mouse clicks, you can easily create a customized list of stocks that will provide you with the exact type of trading candidate you are looking for.

Back Testing and Simulation

OmniTrader offers advanced testing capability to see how strategies performed on one security or on your whole list of stocks. You can backtest your stocks on decades of data in order to measure performance, and then use our Portfolio Simulation feature to see performance based on multiple allocation methods.

EquityCurve

Charting

Chart Patterns

OmniTrader comes with state of art Chart Pattern Recognition to help you find stocks that are poised to move. Support and Resistance, Trendlines, Fibonacci Retracements and more are automatically displayed in your charts. You can also sort your list of stocks by detected patterns to easily the find the type of setup that you are looking for.

OT Chart IBM

Line Studies

Draw many of the most popular line studies in your OmniTrader charts in order to help you make trading decisions. OmniTrader includes the ability to put trendlines, support/resistance lines, Fibonacci Retracement lines, and more on all of your charts, and then you can view these lines in any timeframe.

You can also be notified when one of these lines has been penetrated with line alerts. Simply click on a line and set it as an alert, and you will receive a message if a trendline is broken or support has been penetrated.

OT Chart Coca-Cola

Advanced chart types

OmniTrader allows you to create a chart in any timeframe, and it also gives you the ability create charts that are not based on a timeframe. We refer to these charts as Non-Time Based Charts (or NTB Charts). NTB charts will only form a bar when a price or volume criteria has been met. These types of charts include Range Bars, Renko, Tick, Three Line Break, and they are used by many successful traders to filter out the noise in the market.

NTB charts make it easier to identify the dominant trend and gauge the best time to enter and exit trades. OmniTrader is also the only software capable of applying trading strategies to NTB charts accurately. Use any of the provided strategies or your own strategies to analyze NTB charts and see how the strategy would have historically performed on an NTB chart.

OT Chart Merck

Paper Trading

Paper Trading

OmniTrader allows you to create an unlimited number of paper trading accounts so you can practice trading with the software with no risk. Our paper accounts will mimic actual trading by including commission charges for each security type, tax implications and margin.

You can view, edit and create paper trading accounts in our portfolio feature. Check on your open positions, see your position history, and add to your account with just a few clicks. OmniTrader’s paper trading capability will prepare you to take your trading to the real market

Trading Simulation

While paper trading allows you to practice trading in the current market, many traders want more practice by trading on historical data. This is where OmniTrader shines. OmniTrader delivers advanced trading simulators to let you practice trading any market – intraday or after hours. Easily step through years of data as OmniTrader analyzes the market exactly as it would have on that day. There is no forward look by any of the analysis tools in the software, so you are honing your skills just like you had been trading the markets for years.

Broker Tools

Ready to take your trading to the real market? OmniTrader offers you the ability to trade directly from your charts with any of our supported brokers. Simply click on the Trade icon, and the quick trade interface is presented – preloaded with the symbol that you are currently charting.

Once you’ve entered a trade, you can manage your position in the charts as well. Place a loss stop at an exact chart level, or determine where on your chart you are going add to your position. OmniTrader even includes “virtual” orders which allow your trade to be managed on your computer – and hiding your orders from the rest of the market! OmniTrader’s integrated brokerage tools give you a unique trading advantage.

Forest Bergen lanceert nieuwe website

Forest Bergen lanceert een nieuwe website. Op deze site vindt u naast de beleggingssoftware en cursussen, ook veel boeken voor beleggers en traders. De boeken worden direct door Bol.com geleverd zowel nieuwe- als gebruikte boeken.


Optiemaat

Optiemaat-W
De Rolls Royce onder de optieanalyseprogramma’s. De uitgebreide functionaliteit, in combinatie met het gebruikersgemak van Windows-XP/-Vista/-7/-8/-10, waarborgt een ongekend niveau van praktische toepasbaarheid voor de belegger in opties, al dan niet in combinatie met aandelen en/of futures.

Mogelijkheden:

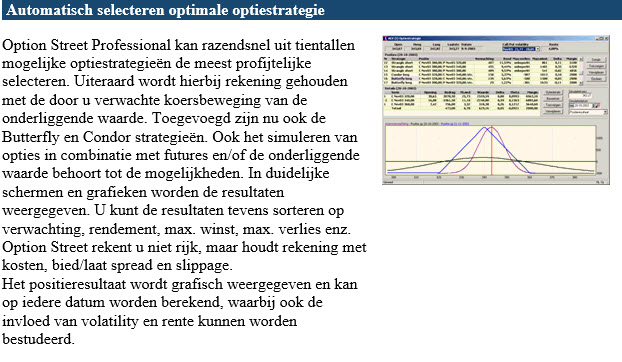
  • U kunt zelf alle denkbare optiestrategieën, ook in combinatie met futures en onderliggende waarden, moeiteloos opbouwen en doorrekenen op rendement, risico en hoogste kans op winstgevendheid.
  • U kunt ook het programma opdracht geven om de meest winstgevende optieconstructies te berekenen, die aansluiten op:
    • uw visie op toekomstige koersontwikkelingen,
    • uw beleggersprofiel.
  • OPTIEMAAT beschikt over 47 verschillende optiestrategieën. Deze worden, afhankelijk van de verwachte koersontwikkeling, door het programma in meervoudige varianten ingezet. Natuurlijk kunt u ook zélf bepalen welke afzonderlijke optiestrategie moet worden geanalyseerd.
  • Heeft u al een positie?
    • Het programma vertelt u exact welke transacties u moet verrichten om uw positie weer optimaal  te doen aansluiten op de (gewijzigde) marktomstandigheden en/of verwachte koersontwikkelingen.
    • U kunt hierbij aangeven of de nieuwe positie moet worden ingenomen op basis van gehele of gedeeltelijke herinvestering óf winstneming…

Gebruiksvriendelijk:
U hoeft zelf geen gegevens in te voeren. Het programma heeft niet meer nodig dan de (actuele) noteringen van opties en onderliggende waarden, zie Beursgegevens. Volatiliteit en rente worden berekend en uitoefenprijzen en expiratiedatums worden automatisch aangepast aan de beschikbare optieseries. Dividendgegevens, margin%’s, rentecurve, samenstelling van indices en historische e-o-d optienoteringen t.b.v. BackTrack kunt u downloaden vanaf onze internetsite.
Zo kunt u al uw tijd en aandacht richten op het onderbouwen van uw beleggingsbeslissingen.

Het programma is Nederlandstalig van opzet en beschikt over een uitgebreide handleiding. Deze is ook volledig in het programma geïntegreerd.

Nauwkeurig:
Voor een juiste optieanalyse is een nauwkeurige waardering van opties essentieel.
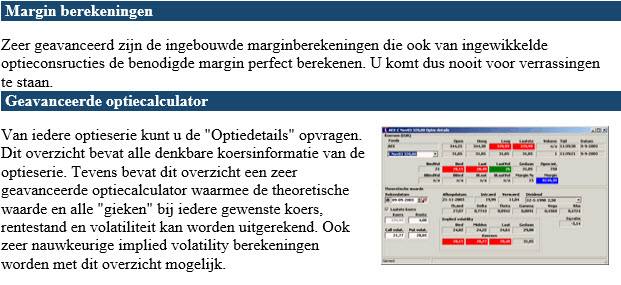
Bij de theoretische optiewaardering speelt de verwachte beweeglijkheid of volatiliteit (volatility) van de onderliggende koers van het fonds de belangrijkste rol. OPTIEMAAT maakt daarom standaard gebruik van de impliciete volatiliteit (implied volatility) IV, afgeleid uit de actuele marktprijzen van alle beschikbare optieseries.

Sommige optieanalyseprogramma’s gaan uit van de historische of statische volatiliteit, gebaseerd op de koersbewegingen gedurende een bepaalde periode in het verleden. Ten onrechte, want het verleden speelt slechts een rol op de achtergrond. Primair wordt de prijs van een optie bepaald door verwachtingen van beleggers omtrent volatiliteit en rente (en dividenden)!

De intraday IV ontwikkeling wordt ook grafisch, over een periode van 10 (beurs)dagen, weergegeven als extra element om de juiste in- en uitstapmomenten te kunnen bepalen. De IV van series met een nog zeer korte resterende looptijd, zoals dag- en weekopties, worden daarbij onderscheiden getoond.
Het programma werkt bovendien ook met de impliciete (financierings)rente en geplande dividenden worden naar de toekomst geëxtrapoleerd voor een adequate waardering van langlopende optieseries.
Vanaf de professionele versie beschikt het programma hiertoe ook over een instelbare langlopende rentecurve.  Hiervoor kunt u updates downloaden vanaf onze internetsite.

Natuurlijk kunt u desgewenst ook gebruik maken van de historische volatiliteit en rente, bijvoorbeeld als u niet over voldoende (actuele) optieprijzen beschikt.
De berekende impliciete volatiliteit wordt dagelijks e-o-d opgeslagen zodat u de ontwikkeling hiervan, in relatie met die van de historische waarde en de onderliggende koers, over elke periode in het verleden kunt analyseren…
Ook de dag- en weekopties op de AEX-index en weekopties op aandelen zijn in het pakket, afzonderlijk en óók geïntegreerd met de ‘reguliere’ maandopties, beschikbaar.

OPTIEMAAT-WE, de expert uitvoering van het programma, bevat o.a. meerdere rentecurve(n) en crossmargin tabellen en vele andere extra functies voor een optimale afstemming op de praktische situatie van elke belegger.

Rendement én risico in beeld…
Voordat u in de markt stapt – bij elke vorm van beleggen en zeker met opties – is het van belang om vóóraf rendement en risico van uw positie tegen elkaar te kunnen afwegen (risicoprofiel).
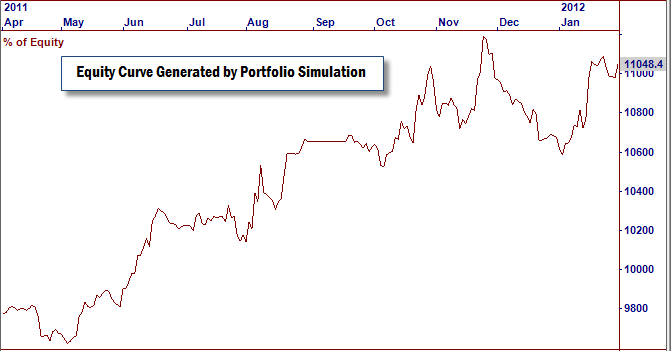
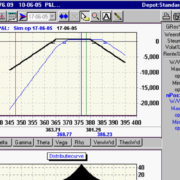
Het programma biedt u uitgebreide grafische simulatiemogelijkheden, naar diverse gezichtspunten, om u inzicht te geven in de verhouding tussen (potentieel) rendement en risico en de ontwikkeling van alle risicoparameters.

Positiebeheer en -bewaking:
Ingenomen posities – die kunnen bestaan uit opties, onderliggende waarden (aandelen) en/of futures – kunnen worden opgeslagen in een portefeuille-depot en dagelijks worden gevolgd op actuele resultaten. Bovendien signaleert het programma u tijdig wanneer uw positie in aanmerking komt om te worden bijgesteld…

BackTrack(end-of-day):
De module BackTrack beschikt over een database met 7+ jaar e-o-d ‘optiehistorie’ van alle Euronext optiefondsen. Op basis hiervan kunt u terug in de tijd en uw eigen posities uit het verleden ‘naspelen’ en/of ‘overdoen’. Bovendien kunt u ook ‘nieuwe’ posities in het verleden opzetten (ook via de module ‘Adviezen’) en de ontwikkeling van de resultaten van dag tot dag volgen. (Backtest)
Hierdoor kunt u, zonder dat er “echt geld” op het spel staat, leren handelen op basis van ‘echte’ beursgegevens.

BackTrack(intra-day):
Geavanceerde versie van de BackTrack (e-o-d) module.
Voor de (zeer) actieve belegger biedt dit de unieke mogelijkheid om (per fonds!) een database op te bouwen met intra-day optienoteringen (minimum interval 30 minuten!).
Hierin worden ook automatisch de exacte noteringen op uw ’trading momenten’ vastgelegd.

Beursgegevens:
Uiteraard kunt u analyseren op basis van actuele beursnoteringen met realtime datasystemen als:
VWD/(v/h EuroBench), Tenfore en MyTrack. Maar u kunt óók de gegevens ‘handmatig’ downloaden bij   VWD/(v/h EuroBench) en GlobalData.

Bent u geïnteresseerd in meer informatie?
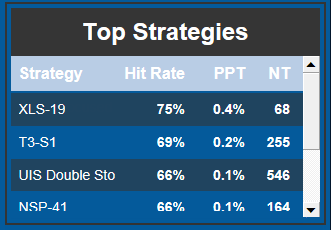
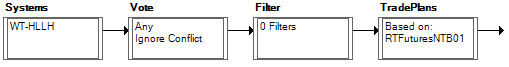
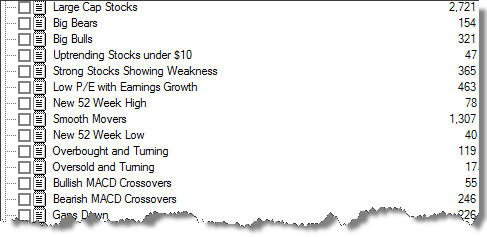
Futures Option Street

  • Call long
  • Call short
  • Call short gedekt
  • put long
  • put short
  • put long + aandelen
  • Straddle long
  • Straddle short
  • Time spread call long
  • Time spread call short
  • Time spread put long
  • Time spread put short
  • Price spread call long
  • Price spread call short
  • Price spread put long
  • Price spread put short
  • Strangle long
  • Strangle short
  • Butterfly long
  • Butterfly short
  • Condor long
  • Condor short
Strategie analyse
  • Automatisch meest profijtelijke strategie berekenen
  • Strategie zelf samenstellen
  • Strategie wizard
  • Delte neutrale strategieën
  • Eigen posities bewaren
  • Positiedetails met uitgebreid transactieoverzicht
  • Marginberekening over totale strategie
  • Berekening resultaat incl. kosten en slippage
  • Berekening met middenkoers of bied/laat
  • Grafische weergave positie en “grieken”
  • Zeer uitgebreide strategiesimulatie en “what if…” berekeningen
Optiemonitor
  • Layout volledig instelbaar
  • Optiecalculator
  • Unieke price- en timespread berekening
  • Theoretische waarde volgens Black & Scholes
  • Berekening Delta, Theta, Gamma, Rho, Vega en Equivalentie ratio
Volatility Analyse
  • Historische volatility onderliggende waarde
  • Implied volatility voor puts en calls
  • implied volatility per afloopmaand
  • Grafische analyse implied volatility per afloopmaand en uitoefenprijs (volatility skew)
  • Historische implied volatility van calls en puts
  • Volatility en implied volatility kunnen als indicator in koersgrafiek worden geplaatst.
  • Volatility en implied volatility kunnen met technische indicatoren worden geanalyseerd; ideaal voor volatility trading!
Overige mogelijkheden
  • Transactiekostentabellen belangrijkste broker (zelf instelbaar)
  • Koppeling orderdeks broker (Binck)
  • Optieberekeningen houden rekening met dividend
  • Dividend extrapolatie voor juiste berekening lange opties
  • Berekening call/put ratio en grafische weergave
  • Volledige integratie met Wall Street Professional
  • Alle berekeningen worden real-time uitgevoerd met de laatste ingelezen koersen

TA Reporter

TA Reporter Professional is een expertsysteem voor technische analyse. Kennis van ervaren technisch analisten is in deze optionele module van Wall Street Professional verwerkt om fondsen een rapportcijfer te geven op basis van een technische analyse radarscan. Hierbij wordt mede rekening gehouden met automatisch berekende steun- en weerstandsniveaus. U kunt met deze software met één druk op de knop uw portefeuilles, monitoren of gehele fondsenbestand doorlichten. Kortom, de TA Reporter geeft u in een handomdraai een compleet technisch advies

Folder TA reporter


Option Street Professional

Option Street Professional biedt de actieve optietrader het onmisbare gereedschap om in de huidige volatiele markten geld te verdienen met opties. Automatisch selecteren van de beste optiestrategie, marginberekening, volatility analyse, optiemonitor, optiecalculator en nog meer maken Option Street Professional een zeer volledig optieprogramma. Geïntegreerd in Wall Street Professional als optionele module geeft Option Street alles wat u nodig heeft om optimaal te kunnen profiteren van de kansen die de optiebeurs u biedt.

Folder Option Street Professional

Futures Option Street