Charting
Chart Patterns
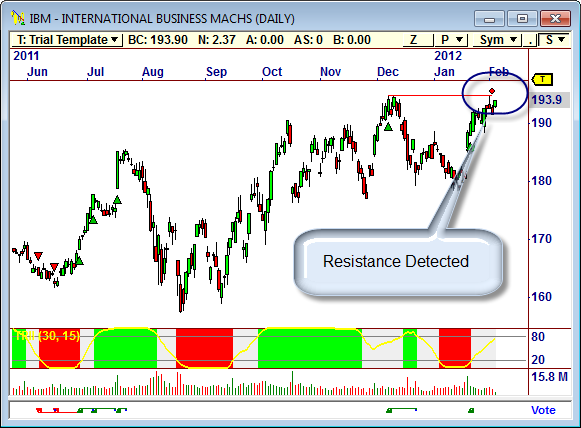
OmniTrader comes with state of art Chart Pattern Recognition to help you find stocks that are poised to move. Support and Resistance, Trendlines, Fibonacci Retracements and more are automatically displayed in your charts. You can also sort your list of stocks by detected patterns to easily the find the type of setup that you are looking for.
Line Studies
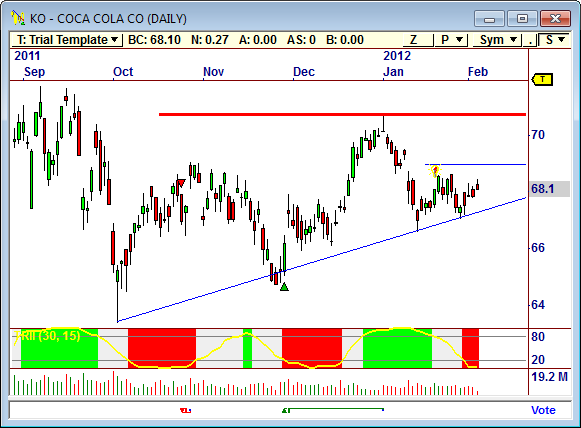
Draw many of the most popular line studies in your OmniTrader charts in order to help you make trading decisions. OmniTrader includes the ability to put trendlines, support/resistance lines, Fibonacci Retracement lines, and more on all of your charts, and then you can view these lines in any timeframe.
You can also be notified when one of these lines has been penetrated with line alerts. Simply click on a line and set it as an alert, and you will receive a message if a trendline is broken or support has been penetrated.
Advanced chart types
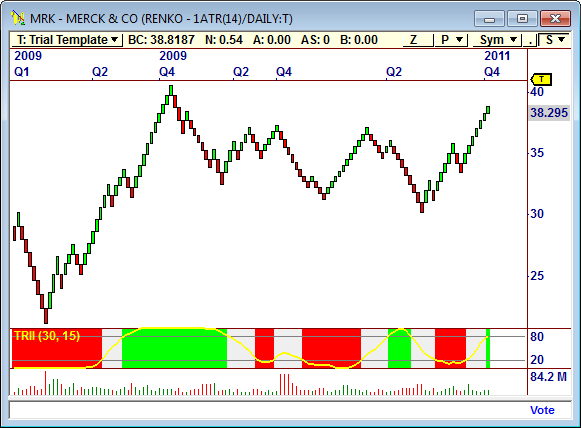
OmniTrader allows you to create a chart in any timeframe, and it also gives you the ability create charts that are not based on a timeframe. We refer to these charts as Non-Time Based Charts (or NTB Charts). NTB charts will only form a bar when a price or volume criteria has been met. These types of charts include Range Bars, Renko, Tick, Three Line Break, and they are used by many successful traders to filter out the noise in the market.
NTB charts make it easier to identify the dominant trend and gauge the best time to enter and exit trades. OmniTrader is also the only software capable of applying trading strategies to NTB charts accurately. Use any of the provided strategies or your own strategies to analyze NTB charts and see how the strategy would have historically performed on an NTB chart.