Elwave
Nederlands talig
ELWAVE is niets minder dan een doorbraak in de geautomatiseerde Elliott Wave analyse. De automatische analyse, die het hart vormt van deze software en reeds lang wereldwijde faam geniet wegens zijn ongeëvenaarde kracht, heeft een ongekende verbetering ondergaan, die gebaseerd is op onze onderzoeksinspanningen van de laatste jaren. Het resultaat is verbluffend: analyses worden gemaakt met een nog grotere nauwkeurigheid en consistentie dan voorheen al het geval was en zijn nog even objectief en snel voltooid als eerst. Tijdframes en golfgroottes zijn nu volledig consistent met hetgeen gebruikelijk is in de gangbare literatuur over de Elliott Wave theorie. Door deze verhoogde consistentie zijn signalen op meerdere tijdframes eenvoudiger te onderscheiden en te duiden, zodat u met gemak kunt handelen op een specifieke beleggingshorizon.
Enkele eigenschappen zijn de (optioneel) volledig naadloos geïntegreerde ondersteuning. Ondersteuning voor data van Realtick. Voor diegenen die (tevens) gebruik maken van WallStreet is tevens zeer interessant de (optionele) naadloze koppeling aan de data van WallStreet voor zowel dagkoersen als realtime. Uiteraard worden ook nog steeds de andere datafeeds ondersteund zoals EuroBench, Reuters, interactivebrokers en vele anderen.
Verder is de gebruikersinterface verbeterd en vereenvoudigd, onder andere door:
- Snelle Symboolinvoer
Maakt het mogelijk direct iedere grafiek te openen door eenvoudig het symbool in te tikken of te selecteren, zonder hiervoor zelfs maar de muis te hoeven gebruiken - Automatisch bestandsonderhoud
- Automatische analyse bij het openen van een nieuwe grafiek
- Nieuwe knoppenbalk voor de meest gebruikte functies
ELWAVE® is the leading Elliott Wave trading software, offering the very best in automated Elliott Wave analysis. With ELWAVE® you can:
- Find the best opportunities for trades based on a thorough, fully automated Elliott Wave analysis
- Know exactly when to get out of a trade
- Trade virtually any type of security including stocks, commodities, futures and forex
- Trade any time frame, from position trading to day trading
- Trade any market
- Automatically monitor your trading in real-time with fully customizable conditions for audio or email alerts
- Use data from your favorite daily or real-time data vendor
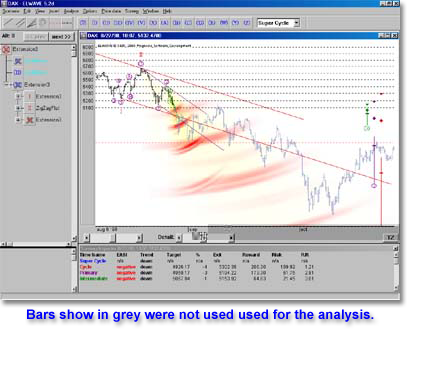
 Unlike with other so-called Elliott Wave software products, what you get with ELWAVE® is the real deal: a thorough Elliott Wave analysis. ELWAVE’s analysis engine uses a model that includes the whole of Elliott Wave theory, including essential aspects such as the fractal nature of Elliott Wave, without simplifications or shotcuts, thereby offering you the full power of this method. In addition, ELWAVE’s analysis is always consistent, objective and unbiased. As complicated as Elliott Wave Theory may be, using ELWAVE® is simple. Here’s why.
Many traders who try to use Elliott Wave in their trading focus on finding the one best wave count and base their trades upon this supposedly only correct analysis. In reality there is almost always more than just one valid wave count. Instead of obsessing about which of these is the best or ‘right’ one, ELWAVE® keeps track of all valid wave counts for you and gives you clear signals based on their degree of consensus. This is the best way to find good trading opportunities using Elliott Wave Theory and ELWAVE® is the only software that can do this.
What this means is that you don’t have to bother yourself so much with the actual wave counts themselves. Just take a look at the Summary Inspector and the Target Clusters and you will get an instant feel of what the market is doing and where it’s going. Read on to find out how this works.
Core analysis features – Elliott Wave analysis, Trading Signals & Target Clusters
The basis for all of ELWAVE’s analytical power is formed by the Elliott Wave analysis engine contained in the Automatic module. The Automatic module generates multiple wave counts, labels the chart and draws trendlines, target levels and exit levels. In short a complete, Elliott Wave based analysis of your chart. The analysis done in the background so you can continue working with your charts while ELWAVE completes its analyses.
Building upon the Automatic module’s analysis results, the Trading Signals module generates a statistical summary which encompasses information from all valid wave counts (see Why ELWAVE is better) and for multiple time frames. The Summary includes readings for the Trend, current wave, Target, Reward, Risk and Riskreward ratio as shown below:
![[Summary Inspector example image]](http://prognosis.nl/elwave/Summary%20Inspector%20example.png)
|
|
| Example Summary Inspector – Move your mouse over the columns for an explanation of each individual item |
With this information you can easily decide whether or not a trade makes sense for you. Even if you don’t know anything about Elliott Wave you will quickly learn how to use this information to your advantage. The information in the Summary can also be used to scan an entire universe of symbols to look for opportunities to trade; more on that in the section entitled Scanning and real-time monitoring below.
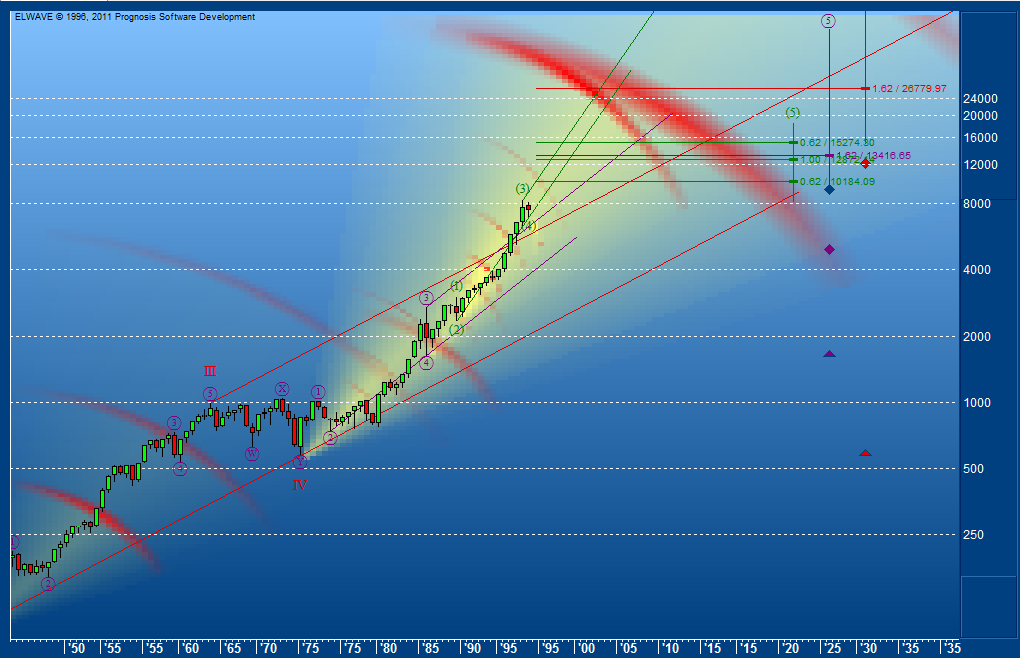
 Even easier to use than the Summary and just as unique to ELWAVE is a feature named Target Clusters. By combining the targets from all wave counts and wave degrees (time frames) and overlaying them graphically on your chart, it allows you to instantly spot the actual trend and the most likely target in terms of price and time as well as the degree of consensus between these wave counts and wave degrees on these important variables. The better an Elliott Wave analysis fits together, the narrower the target bands will be. You can also instantly see if there is discrepancy between projected trends and targets from opposing wave counts.
If you have a real-time feed ELWAVE will constantly check your chart for any events that may trigger a signal such as confirmation of a wave which can result in new target and exit calculations.
Together, these core features allow you to reap the maximum benefit from Elliott Wave analysis while avoiding most common pitfalls that might otherwise hinder succesfull application of this powerful analysis method. Only ELWAVE offers this extremely powerful combination of Elliott Wave based analysis tools.
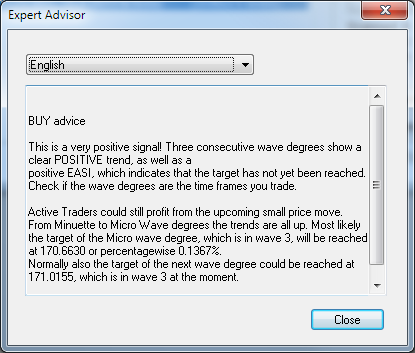
 For traders that want even more guidance there is a final cherry on the pie: the Expert Advisor. This will tell you in plain English how to interpret the analysis results and whether there is an opportunity to make a trade. The Expert Advisor allows anyone to take advantage of the power of Elliott Wave analysis, even if you don’t know anything about Elliott Wave Theory.
By contrast, for Elliott Wave experts the Wave Tree and Wave Inspector offer a unique insight into the heart of the Elliott Wave analysis performed by ELWAVE. You can explore every detail of the analysis and view the complete set of rules and guidelines that have been checked for each individual subwave. You can even create your own wave count either from scratch or using the automatically generated wave count as a basis and let ELWAVE check your count for mistakes or inconsistencies. Again, this is for experts with a keen interest in Elliott Wave Theory only; if you don’t want to know how the engine works, just leave the hood closed!
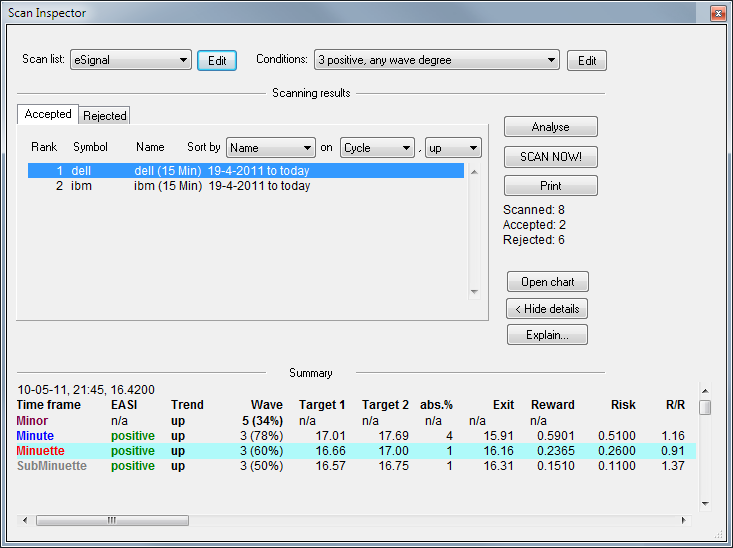
 For traders looking to do stock picking (selecting stocks that are read to explode from a large universe of symbols), the Scan Inspector offers a unique way to filter out those symbols (be it actual stocks, curreny pairs or any other type of security). Because scanning in ELWAVE is based on the trading signals as displayed in the Summary Inspector window, you can scan for (fully customizable) criteria such as trend, reward, risk, riskreward etc. all based on the signals and targets derived from the automated Elliott Wave analysis. By scanning for criteria on multiple time frames (wave degrees) you can scan for, say, a ‘wave 3 in a wave 3 in a wave 3’, or simply for an uptrend in 3 consecutive time frames. Apply your own criteria for reward, risk and riskreward and you will have your own tailor-made trading setup scanner.
For real-time traders we’ve taken the concept of scanning to the next level. Nobody enjoys watching their screen all day waiting for a possible trade. Our Realtime Alerts allow you to lean back and let your computer do the hard work. Simply setup the criteria and let ELWAVE monitor the market for you, alerting you only when an interesting trade comes along based on your own, fully customizable criteria for such things as reward, risk, riskreward etc. all based on the signals and targets derived from the automated Elliott Wave analysis. In fact, you can use the exact same ‘scan conditions’ from the Scanning module to define your Realtime Alerts.
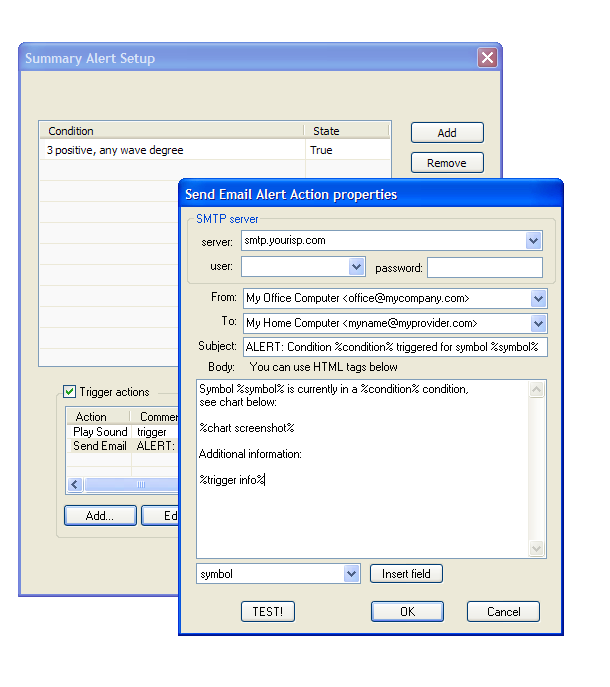
 The actual alert method can be a simple message box or audible signal on your PC or it can be an email that is sent to your mobile phone or PDA, complete with attached screenshot of the chart that triggered the signal. You can even run an external program to respond to the Alert for you automatically.
Read more about real-time alerts and scanning…
Of course ELWAVE is best known for its unrivalled automated Elliott Wave analysis. In addition, it offers everything you might want in end-of-day or real-time technical analysis charting software. A wide range of charting options and standard technical analysis techniques is available. For example you can easily draw Trend lines, Trend channels, Speed lines, Logarithmic Spirals, Trigger lines, Fibonacci time projections, Fibonacci extension and retracement, Gann Fans and Comment boxes to annotate your chart.
![]()
For Trend lines and channels and trigger lines you can define Alerts similar to what was shown in the section on real-time monitoring.
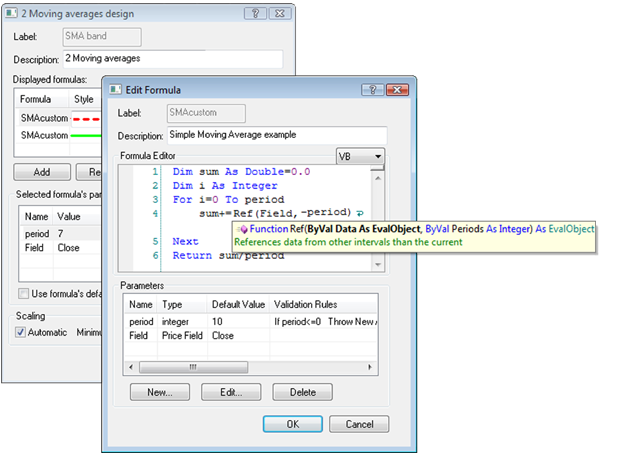
 Of course you can also choose from a range of indicators such as Alligator, DSS Bressert, SMA, EMA, Ichimoku, MACD, RSI, Stochastic, TSI, Bollinger Bands, Keltner Channels, Parabolic, Elliott Oscillator, Stochastic, DMI/ADX, Awesome Oscillator and Accelerator. If that’s not enought you can easily roll your own indicators in either C# or Visual Basic.
When it comes to charting and other basic functionality, ELWAVE offers everything you would expect from a professional charting application. Fast and fluent scrolling, zooming and screen updates with no flicker. For charting styles you can choose between line style, OHLC bars and Candle Sticks charting styles and customize colors and spacing. Indicators can be overlaid on the main chart or kept in separate panes with each pane having a set of tabs to allow quick switching between indicators.
 You can also instantly switch between time intervals with no need to reload data from your data vendor as ELWAVE can instantly show your loaded 1 minute data as, say, 5 minute bars. Keep in mind that the actual interval does not affect a proper Elliott Wave analysis as performed by ELWAVE, switching intervals is for your own convenience and viewing comfort.
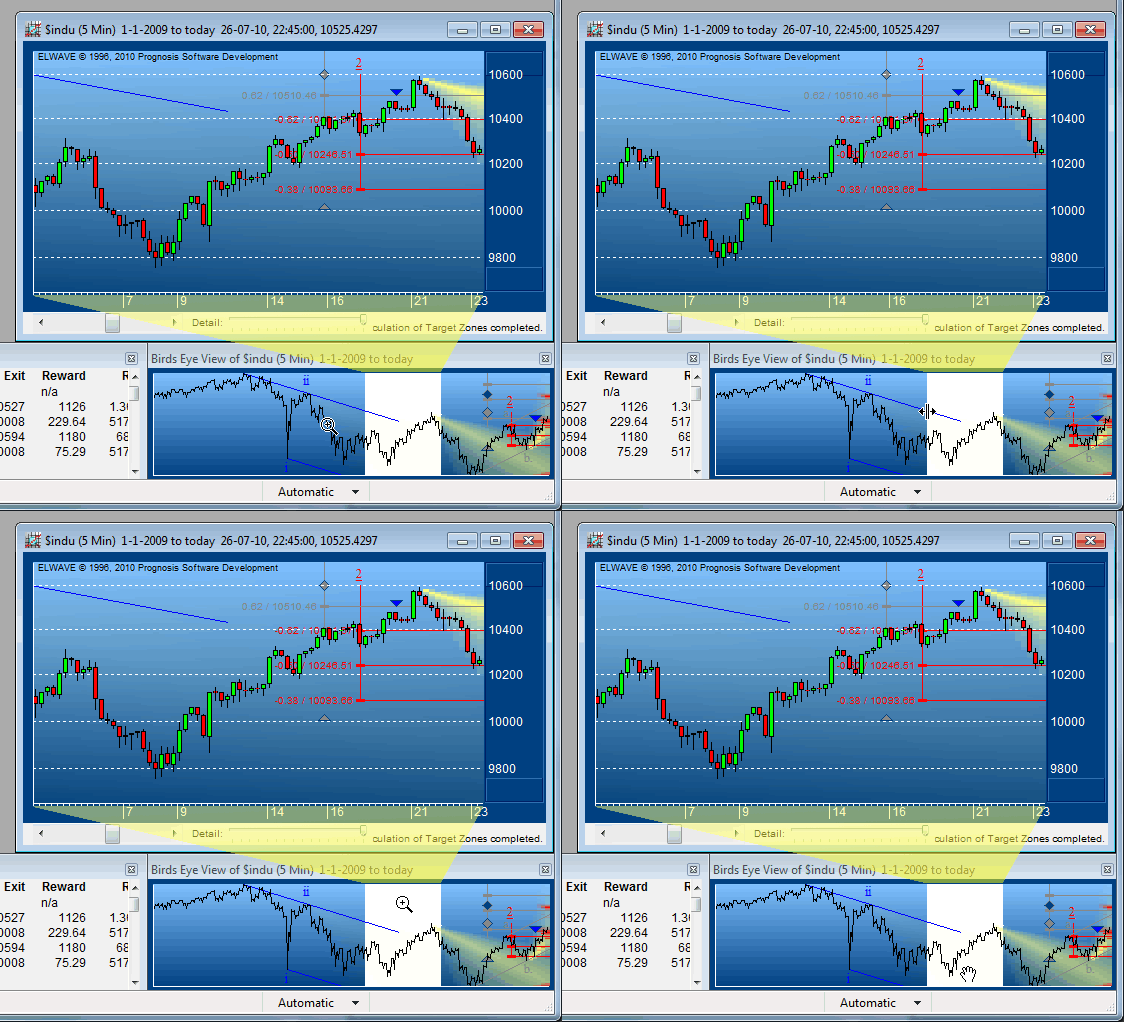
Unique to ELWAVE is the Automatic compression which provides a smooth, continuous re-compression of the underlying data into bars. This allows you to zoom in smoothly on any particular range of your chart (for example with the mouse wheel) with no need to choose between discrete compression steps like 1 minute, 2 minute, 5 minute etc.
The Birds Eye View window lets you keep track of where you are when zooming in on some particular detail of your chart so you will always know where you are. You can also use the Birds Eye View itself for scrolling or zooming in our out. To help you keep your bearings, zooming in ELWAVE is a smooth animated action.
Other features include the ability to save and restore a collection of charts in a single action as a Screen, save your chart layout including preferred indicators as a Template and a Quote Monitor.
ELWAVE is compatible with more data feeds and file formats than any other software: eSignal, IQFeed, TradeStation, MetaTrader 4 & 5,Interactive Brokers, FXCM, TC2000, MetaStock, ASCII (numerous formats), Mubasher Pro, Yahoo, Google, MSN, NinjaTrader (including Kinetick and ZenFire), nimbleDataProPlus and many more. Coming soon: Reuters QuoteCenter (through MetaStock)
With TradeStation you can view part of the analysis results directly in TradeStation. For MetaStock we have developed a special ELWAVE for MetaStock Add-On which can do the same thing for MetaStock. Please note that the regular version of ELWAVE can also import your MetaStock files directly.
Click here for a complete list of supported data vendors and file formats
Applicable markets and time frames – forex too!
Just like Elliott Wave Theory itself, ELWAVE can be used on virtually any market and on any time frame. Whether you trade stocks, futures, forex or commodities and regardless of time frame, you can use the power of ELWAVE to help you make the best trades. Any market that is sufficiently liquid and free can be analyzed.
ELWAVE is capable of analyzing long-term daily charts for long term projections and trades as well as very short term charts down to 1 minute and even tick charts for day trading on the smallest of time frames.
This section is about OS compatibility. For compatiblity with trading platforms see Data feeds.
ELWAVE is compatible with 32 and 64 bit versions of Windows XP, Windows Vista and Windows 7. ELWAVE cannot run inside a virtual machine, the only way to run ELWAVE on a Mac is by booting straight into Windows through Bootcamp.
ELWAVE consists of several fully integrated ‘modules’ so you can purchase a license for just those features that you actually need. Click here to get an instant price quote on any combination of modules.
If you are unsure what modules you would need, please click here for our automated shop assistant which tells you what you need after answering a few simple questions.
Elwave plug-in for Metastock
[posts category=”Elwave-plug-in” cols=4 show=”4″]


